What
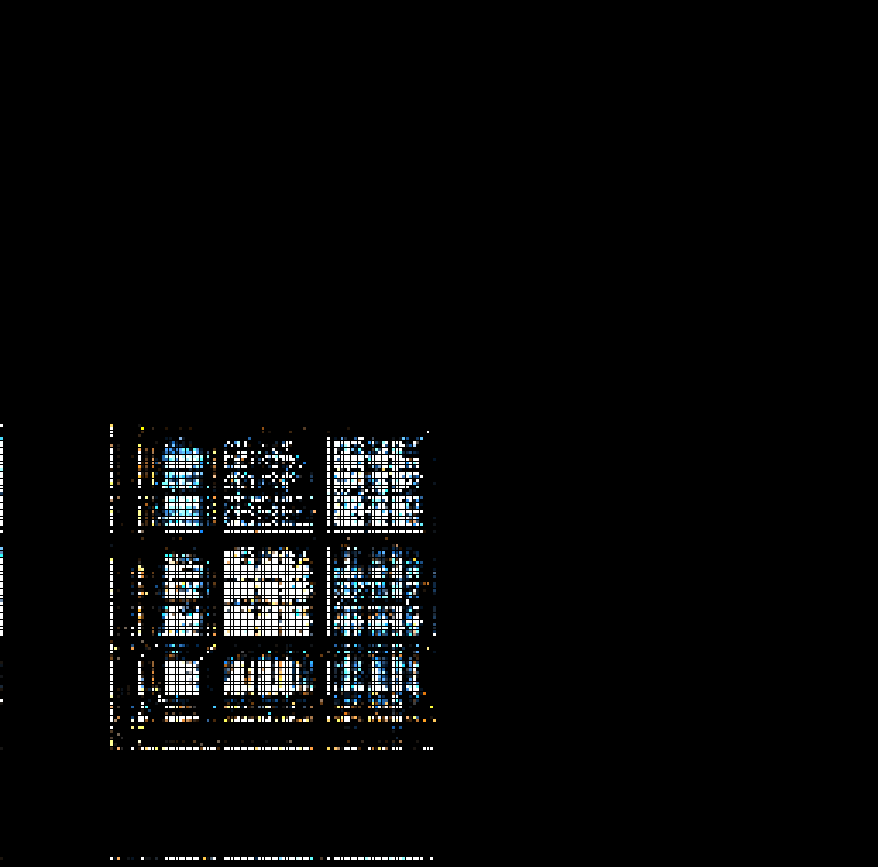
Veles is a neat data visualization tool which helps you take advantage of human pattern recognition. It plus tuples (or triples) of the bytes of files as dots on a 2D X/Y plane (or 3D XYZ space), and the patterns that emerge can immediately give away what kind of data is in the file.
Unfortunately, Veles seems to be a little old and I can’t find an actively maintained fork or any descendant. The lineage seems to be:
- ..cantordust.. from xoreaxeaxeax (Chris Domas) is shown at BlackHat
- Everyone wants it but it’s not released to the public for many years later
- Codilime writes and open-sources Veles
- Wapiflapi writes and open-sources binglide
- Wapiflapi forks codilime Veles and integrates as few ideas from binglide as well as some updates from the upstream Codilime version
- Codilime makes a few more updates but eventually archives the repo in 2020
See also
- https://inside.battelle.org/blog-details/battelle-publishes-open-source-binary-visualization-tool Battelle’s PR page for CantorDust release
- https://corte.si/posts/visualisation/entropy/index.html Post from a CantorDust contributor (I think) mentioning Hilbert curve visualization
- https://binvis.io/, a similar tool as a webapp
- https://github.com/jexxor/cantordust-ng a possible next step…?
Installation
The wapiflapi Veles is the only version I could get to build, mostly following the repo’s build steps:
Deb builds might work
I think the codilime repo has a
.debfile on the releases page — it may work for Debian-based systems. I haven’t tried, as I’m doing this on a Gentoo machine, but if you’re on Debian or any deriviative of it, worth a shot!https://github.com/codilime/veles/releases/tag/2018.05.0.TIF
- Clone the repo
mkdir build- Edit
CMakeLists.txt, punch out theif(GTEST_FOUND)(line 223) and replace withif(0)to prevent tests from building (they don’t) cd buildcmake -DCMAKE_BUILD_TYPE=Release -DCMAKE_POLICY_VERSION_MINIMUM=3.5 ..make
Then launch with ./veles.
See also
The working Git repo: https://github.com/wapiflapi/veles
Usage
Once Veles is running, open a file. By default, you’ll just be shown a hex viewer. Click the “3D” icon in the toolbar to open the visualizer.
The icons on the right control how to visualize data; axes options, 2D vs 3D selection, etc. The vertical section on the left allows you to view only select portions of the file; drag the top and bottom bars to cut off parts of the file (and drag the section around to slide the window of data you’re visualizing).
The window selection can help greatly with interpreting results. Often, large files will contain multiple types of data; sliding the visualizer window around in the file can help you isolate where in the file each kind of data is, and with a little time, you can narrow it down to the exact offset within the file.
Patterns
A few recognizable patterns:
- ASCII text tends to have grids in the lower-left quadrant only
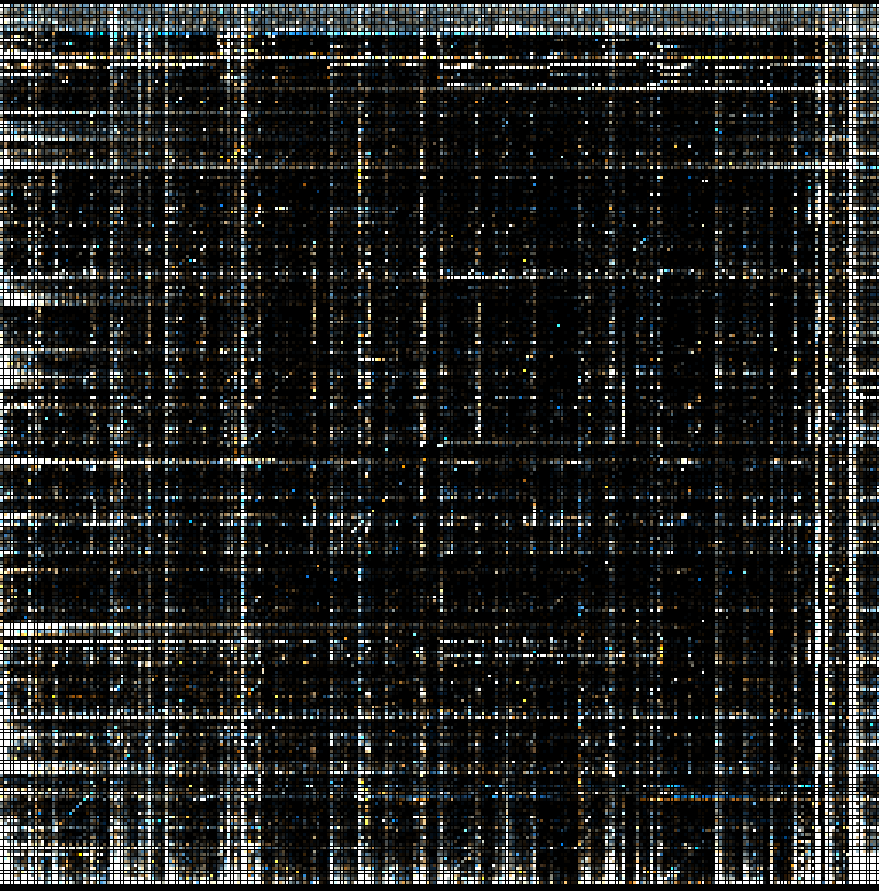
- Executable code tends to have horizontal and vertical lines across the whole space, sometimes dense at the top and bottom. Different architectures may look slightly different.
- ARMv7 little endian:
- x86 (a section of the
gccbinary in this example):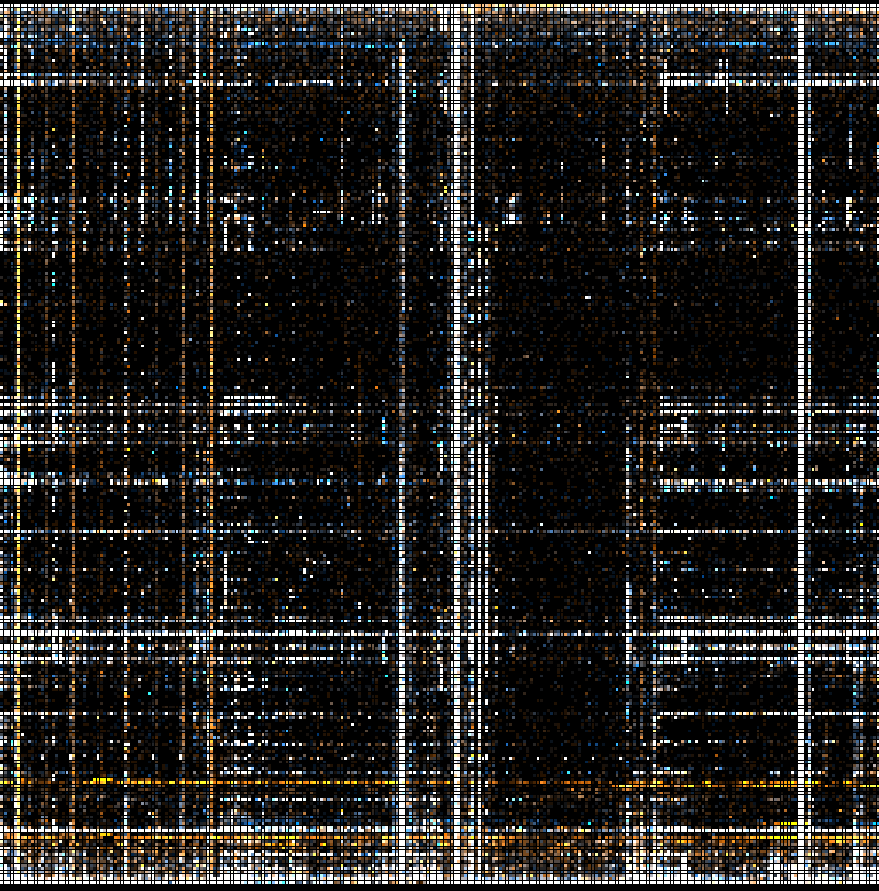
- ARMv7 little endian:
- Various compression formats tend to just look like “noise.” The point of compression is to make the most use of available space, so this kinda makes sense. Encrypted data tends to look similar as well (if you could observe patterns in ciphertext, it wouldn’t be very good encryption).
- ZIP (this actually came from a
.docxfile, which is a zip archive under the hood):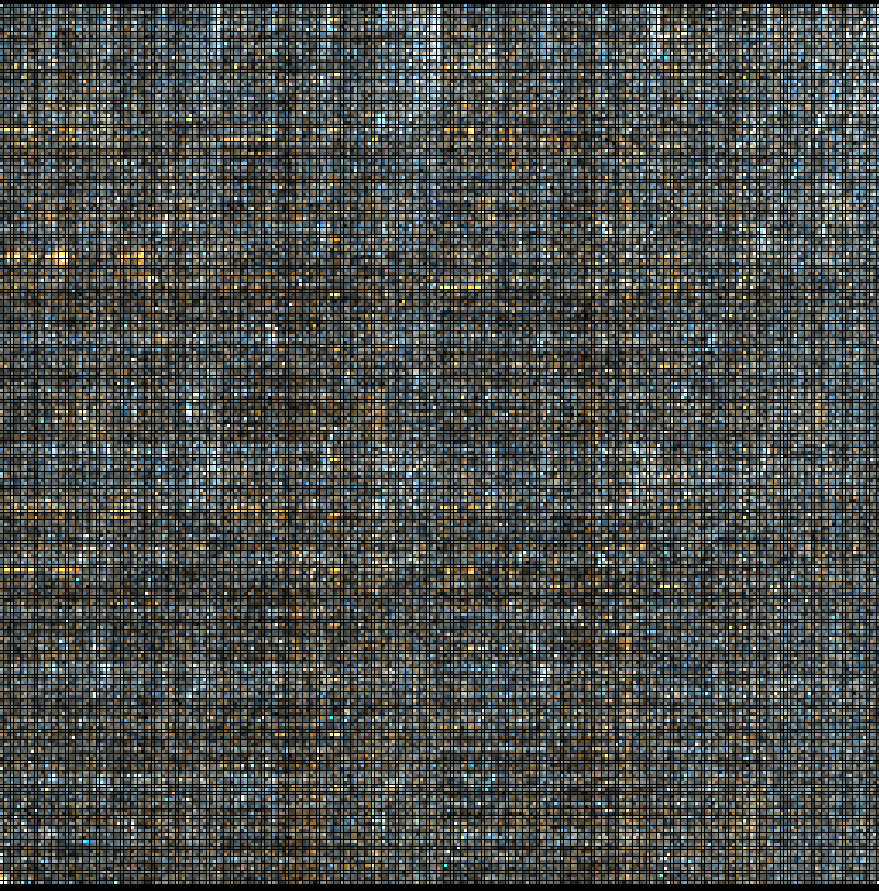
- GZip (specifically, this is a
.tar.gz):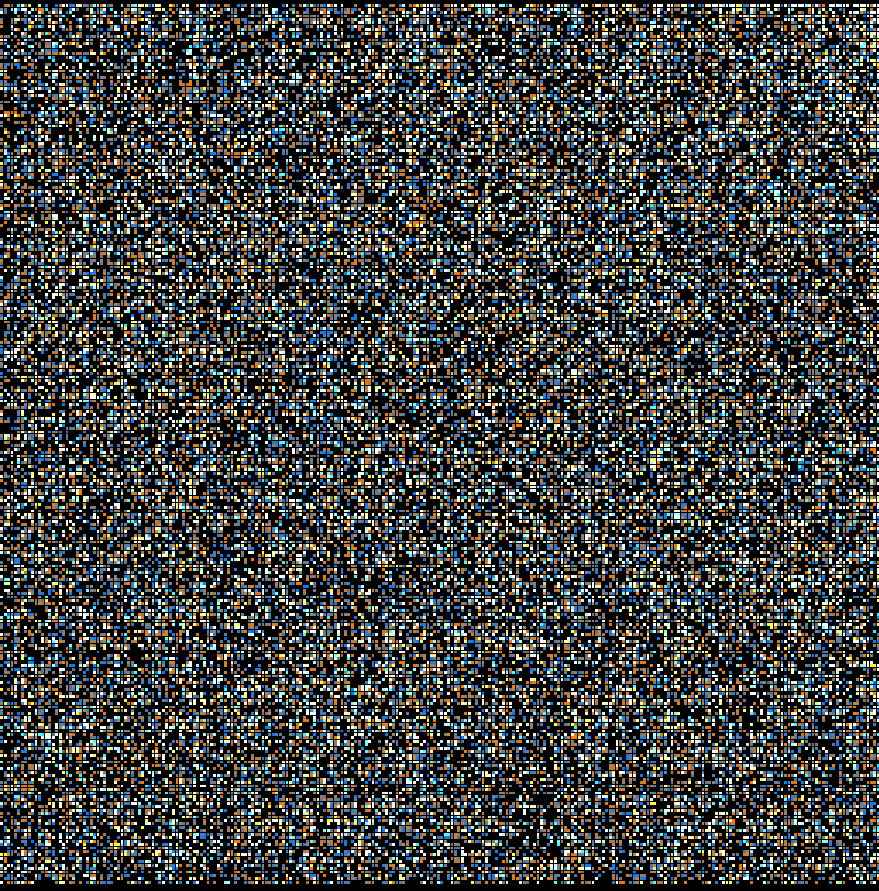
- ZIP (this actually came from a
- Images tend to scatter data. Some compressed formats may look like compressed data. Others may feature diagonal-ish lines.
- JPEG mostly looks compressed (because it is):
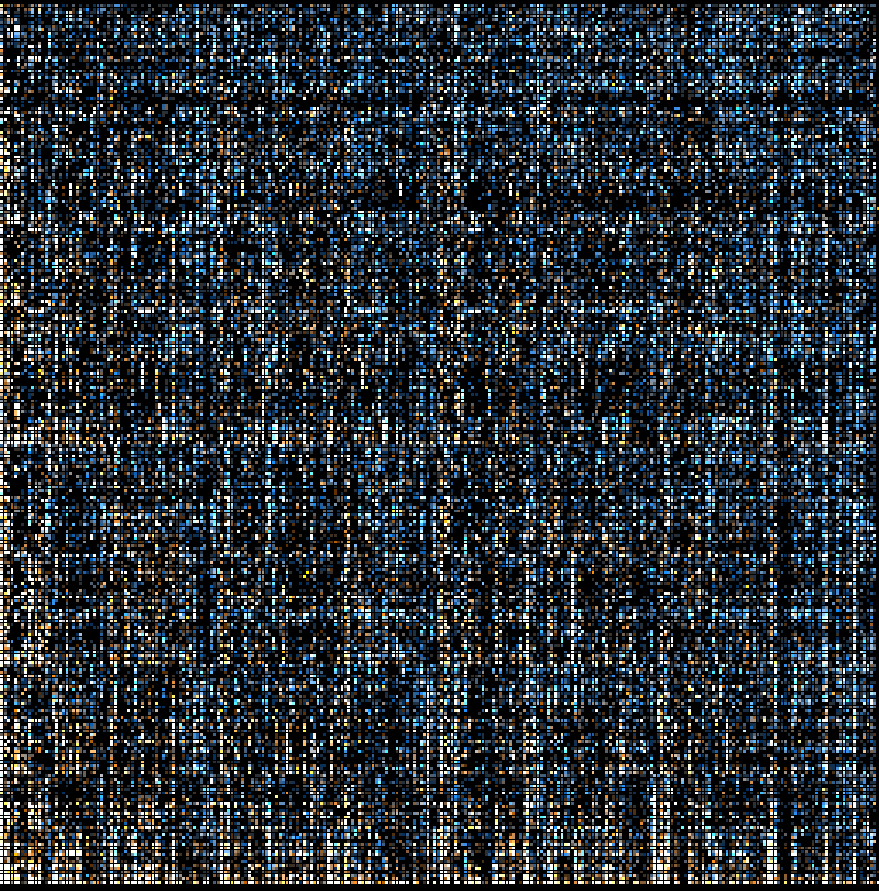
- PNG has some diagonals (sometimes these are more or less pronounced, or at different angles):
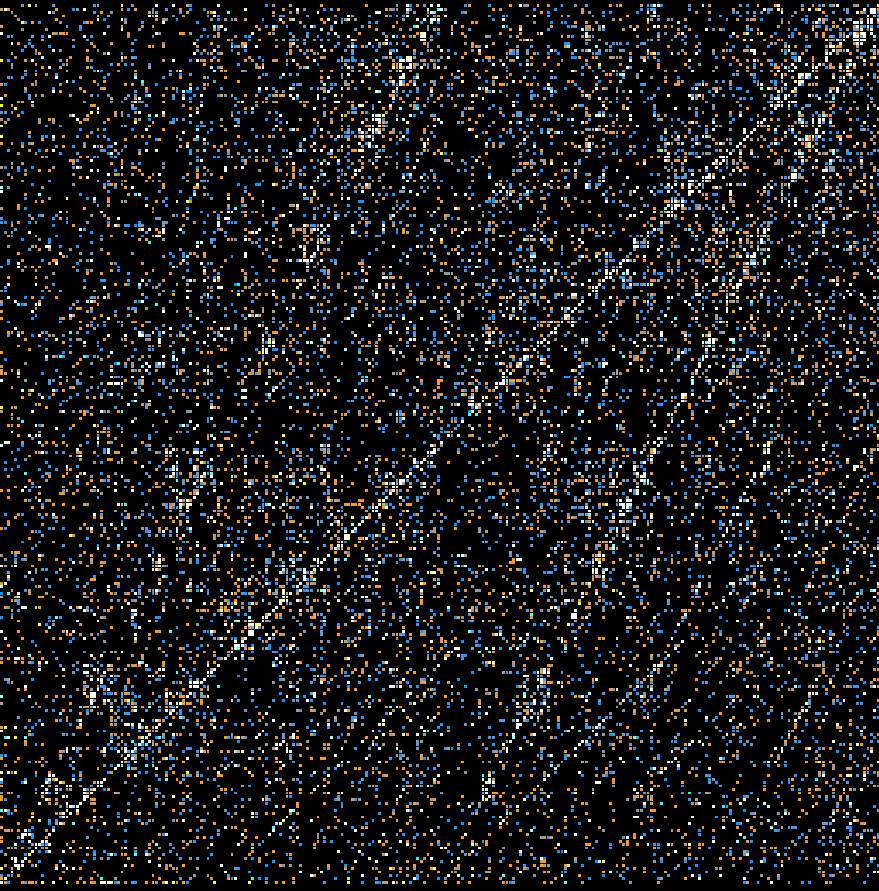
- Bitmap (BMP) files get some very unusual patterns. I’m not sure if this depends on the actual content of the image; because there’s no compression or reformatting happening (it’s literally a bitmap, I wouldn’t bet on this being totally reliable:
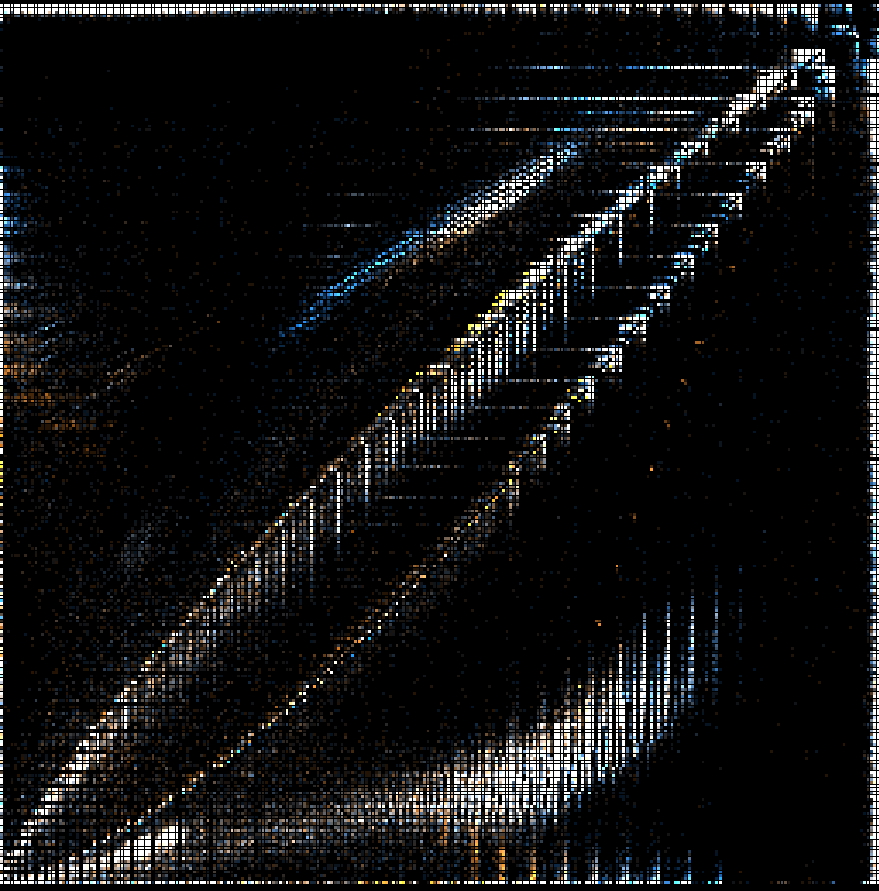
- Here’s another bitmap for example, to highlight that it might be different by image content:
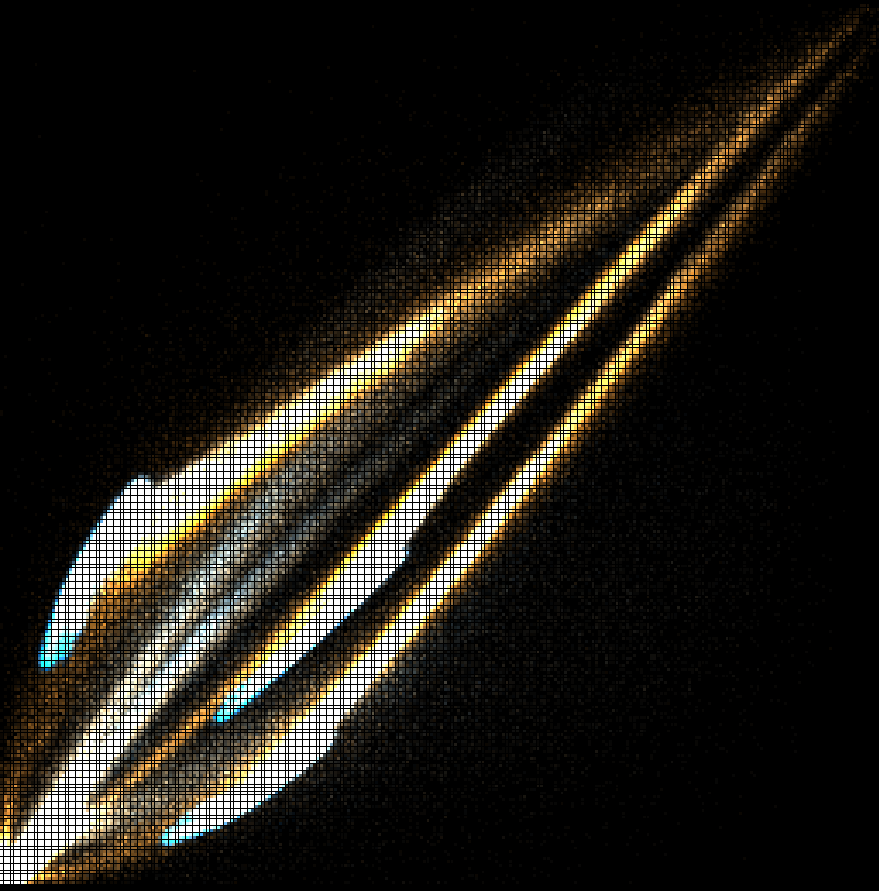
- Here’s another bitmap for example, to highlight that it might be different by image content:
- JPEG mostly looks compressed (because it is):
- Audio files vary wildly by container and codec.
- Opus, ogg, and m4a files are all just compressed and noisy. See the compression examples.
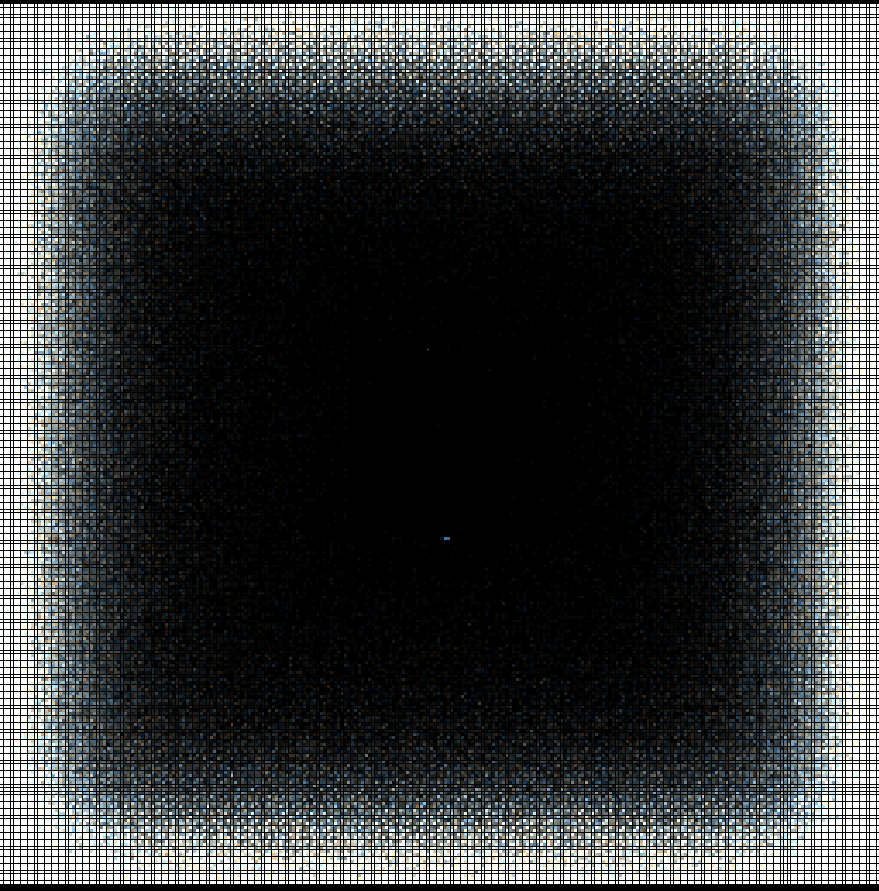
- WAV audio (Container: wav, codec: PCM_S16LE) gets a very unique noise around the outsides:
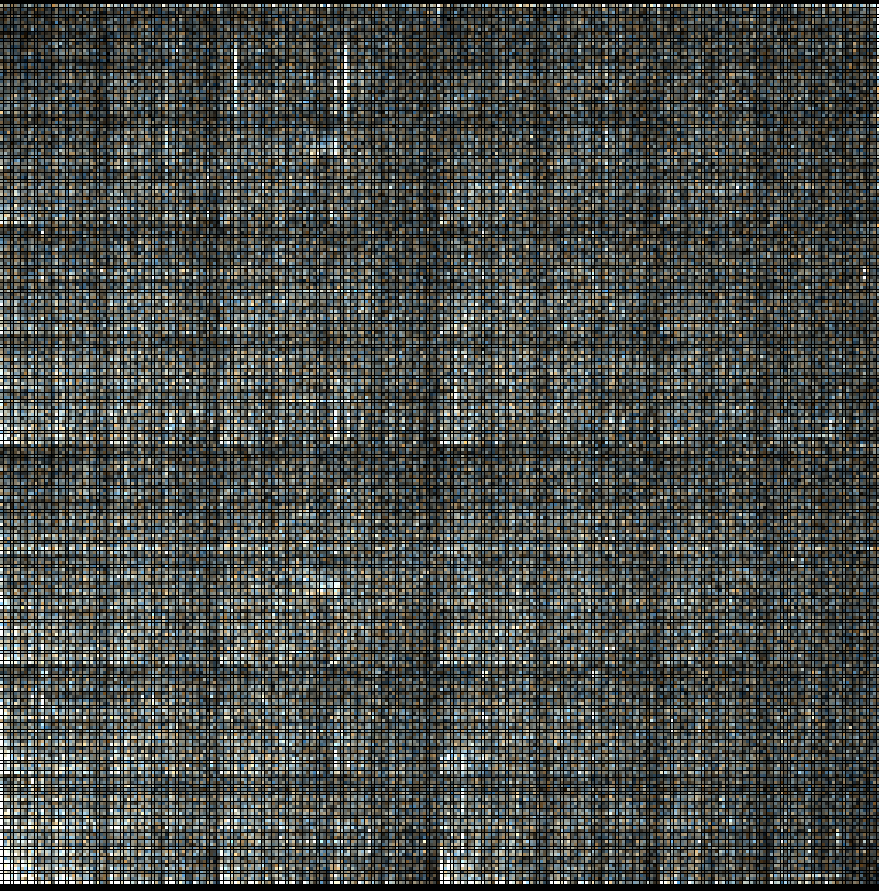
- MP3 audio (container: mp3, codec: mp3) looks nearly compressed, but has some visible square-ish sections if you squint:
- 3D model seem to vary wildly by filetyle:
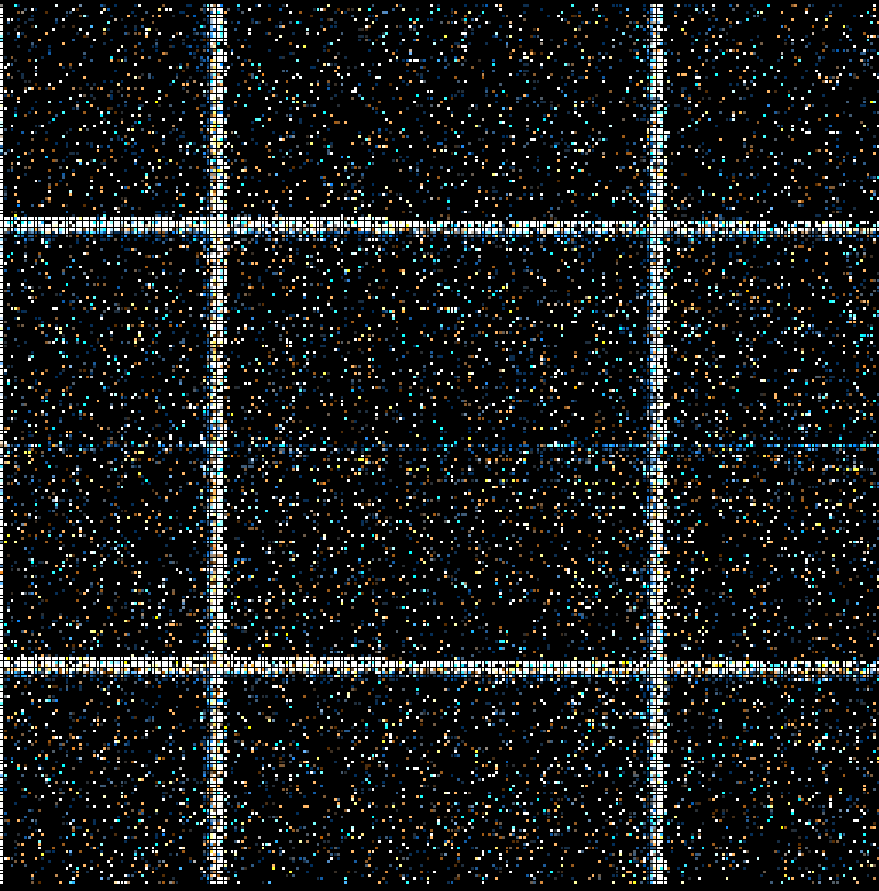
- Stereolithography (STL) files get a set of 2x2 lines:
- “Object” files (
.obj) are just text, but very concentrated in the lower-left quadrant. This is the region of numeric ASCII chars (0-9); obj files are mostly coordinates: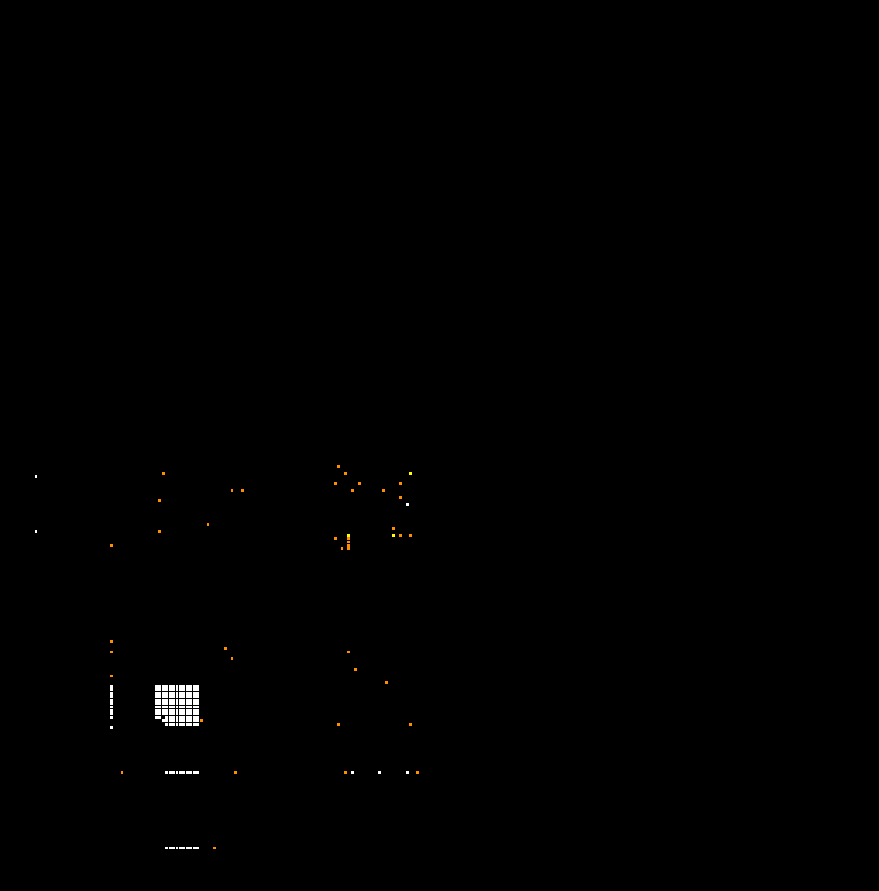
- Stereolithography (STL) files get a set of 2x2 lines: